FAIR annotation and evaluation of RNA sequencing and microarray data – Elucidata
How to unlock the value of RNA sequencing (RNA-Seq) and microarray data from a public repository Gene Expression Omnibus (GEO)
- Using machine-learning assisted curation, guided by the FAIR principles
- Leverage ontologies and controlled vocabularies for annotation

Overview
GEO [1] is a large public-funded repository that primarily supports microarray and RNA-seq data submitted by the research community. These data are publicly available and contain a huge wealth of information. There are over 150,000 series, i.e, records that contain a collection of related samples with a unified research focus, in GEO. However, a majority of these series lack machine-readable standardized metadata at study and sample-levels, limiting reuse. Only ~4300 or 2.9% of series have been curated retrospectively and are available as datasets for advanced analyses. In this use case, we used a subset of the FAIR guiding principles to define customized metrics and establish a baseline FAIR score for GEO. We then defined a machine-learning assisted curation infrastructure to curate microarray and RNA-Seq data at scale and quantified the improvement in FAIR score post curation.
Process
Adapting FAIR guiding principles for microarray and RNA-Seq data
We converted the general FAIR guiding principles as defined by Wilkinson et al. [2] into a set of 8 measurable metrics specifically suited to microarray and RNA-Seq data, as described in Table 1.
| FAIR Principle | Metric | Metric_ID | Relevant GEO metadata field | |
| F2. data are described with rich metadata | Metadata contains biological keywords that describe the study | F2 | !Series_summary | |
| F3. metadata clearly and explicitly include the identifier of the data it describes | Metadata include machine actionable identifier to processed data | F3 | !Sample_supplementary_file
!Series_supplementary_file |
|
| I2. (meta)data use vocabularies that follow FAIR principles | (meta)data metadata are described by biological keywords and their corresponding unique identifier from a reference ontology | I2 | Not applicable (Metadata field for ontology tags not available) | |
| R1.2. (meta)data are associated with detailed provenance | metadata provide information regarding the overall design of the study | R1_2_1 | !Series_overall_design | |
| metadata provide contact information of the creator(s) | R1_2_2 | !Series_contact_email | ||
| metadata specify the publication identifier | R1_2_3 | !Series_pubmed_id | ||
| metadata contain the platform ID | R1_2_4 | !Platform_geo_accession | ||
| the processed data associated with the study contain counts | R1_2_5 | !Sample_data_processing | ||
Calculating baseline FAIR score for GEO
GEO uses a format called Simple Omnibus in Text Format (SOFT), which is a compact, simple, line-based, ASCII text format that incorporates experimental data and metadata.
To calculate a baseline FAIR score for data on GEO, we identified relevant metadata fields for each of the metrics except I2. A scoring strategy (called as s) was then defined as follows:
- If the field contained relevant information, such as keywords and unique machine actionable identifiers, the metric was scored as 1.0 (PASS), if the information was absent, the metric was scored as 0 (FAIL).
- If there were more than one field in a metric, then each field was scored as 0 or 1 and an overall metric score was assigned as the average of each individual field score.
- I2 was scored as zero for all the data on GEO since they do not follow any ontology
Examples of keywords in metadata
| GEO ID | Metadata Tag !Sample_data_processing = Supplementary_files_format_and_content |
FAIR metric evaluation R1_2_5 |
Relevant keywords |
| GSE100007 | TSV files include TPM (transcripts per million) for Ensembl transcripts from protein coding genes in release 84. | Pass | TPM,
FPKM, RPKM, Count, count, Counts, counts |
| GSE100009 | RNA-seq read counts were calculated using HTSeq 0.6.1p1 | Pass | |
| GSE100292 | TSV Files | Fail | |
| GSE100400 | bigwig format, files contain mapped reads on chromosomes Y, 15, 3, 1 for visualization of each investigated marker | Fail |
Each of the metrics was also assigned a weight based on their perceived importance to an in-house team of bioinformaticians, with highest weights assigned to F2, F3, I2 and R1_2_5. The FAIR score for a series was calculated as the weighted average score for the 8 metrics and normalized to a maximum score of 100 (called a composite FAIR score). The distribution of calculated scores for one hundred random studies on GEO is shown in subsequent sections,

where wi = weight of ith metric and s = evaluation score.
ML-assisted curation
We built a ML-assisted curation infrastructure that takes a series and its corresponding samples from GEO, stores the metadata and processed data together in a consistent tabular format, then tags the study and its samples with standard biomolecular ontologies (see listing below) using state-of the-art named entity recognition models. We have used this curation infrastructure to curate ~60000 microarray and RNA-Seq series from GEO, and other public gene expression data repositories LINCS, TCGA, Depmap etc. We have also extended the curation to other omics data such as metabolomics, proteomics and lipidomics.
A feature of the curation infrastructure was that all the metadata and data were indexed and queryable.
Examples of sample tags
A tag is a reference to a term in biomolecular ontologies
- GSM2752553 is a cell line sample that has been treated with a drug, it has two tags – Lu-65 (CVCL:1392) and trametinib (CHEBI:75998)
- GSE107650 is a diet-study involving tissue samples taken from obese patients with NASH, it has the tags Obesity (MESH:D009765), Non-alcoholic Fatty Liver Disease (MESH:D065626) and liver (BTO:0000759)
We use both public and proprietary ontologies for tagging data. Here’s a list of the types of tags we assign (the list is not exhaustive), along with the public ontologies we use:
- Organism: (NCBI Taxonomy) Organism from which the samples originated.
- Disease: (MeSH) Disease(s) being studied in the experiment.
- Tissue: (Brenda Tissue Ontology) The tissue from which the samples originated.
- Cell type: (Cell Ontology) Cell type of the samples within the study.
- Cell line: (The Cellosaurus) Cell line from which the samples were extracted.
- Drug: (CHEBI) Drugs that have been used in the treatment of the samples or relate to the experiment in some other way.
For keeping track of quality of tags we use metrics like accuracy and F1 score. These metrics are calculated w.r.t a gold standard corpus*. We calculate the metrics for 3 sets of tags.
- Human: Tags assigned by human curators
- Polly: Tags assigned by Polly ML models (developed in-house)
- Benchmark: Tags from publicly available ML models on the same metadata [4][5].
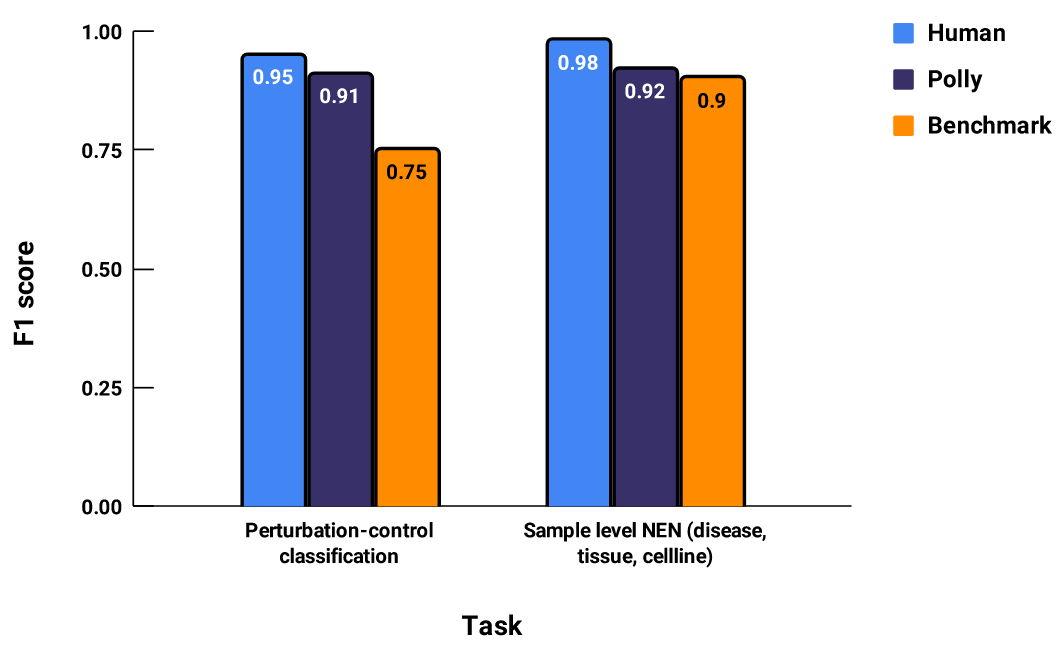
Figure 1: The “Human” F1 score indicates how accurate a human curator is on average.
* The gold standard corpus refers to a small set of GEO studies that were curated by in-house experts and went through several quality control checks. These studies contain tags that we use as the ground truth.
The curation infrastructure and process is described in detail in Figure 2.
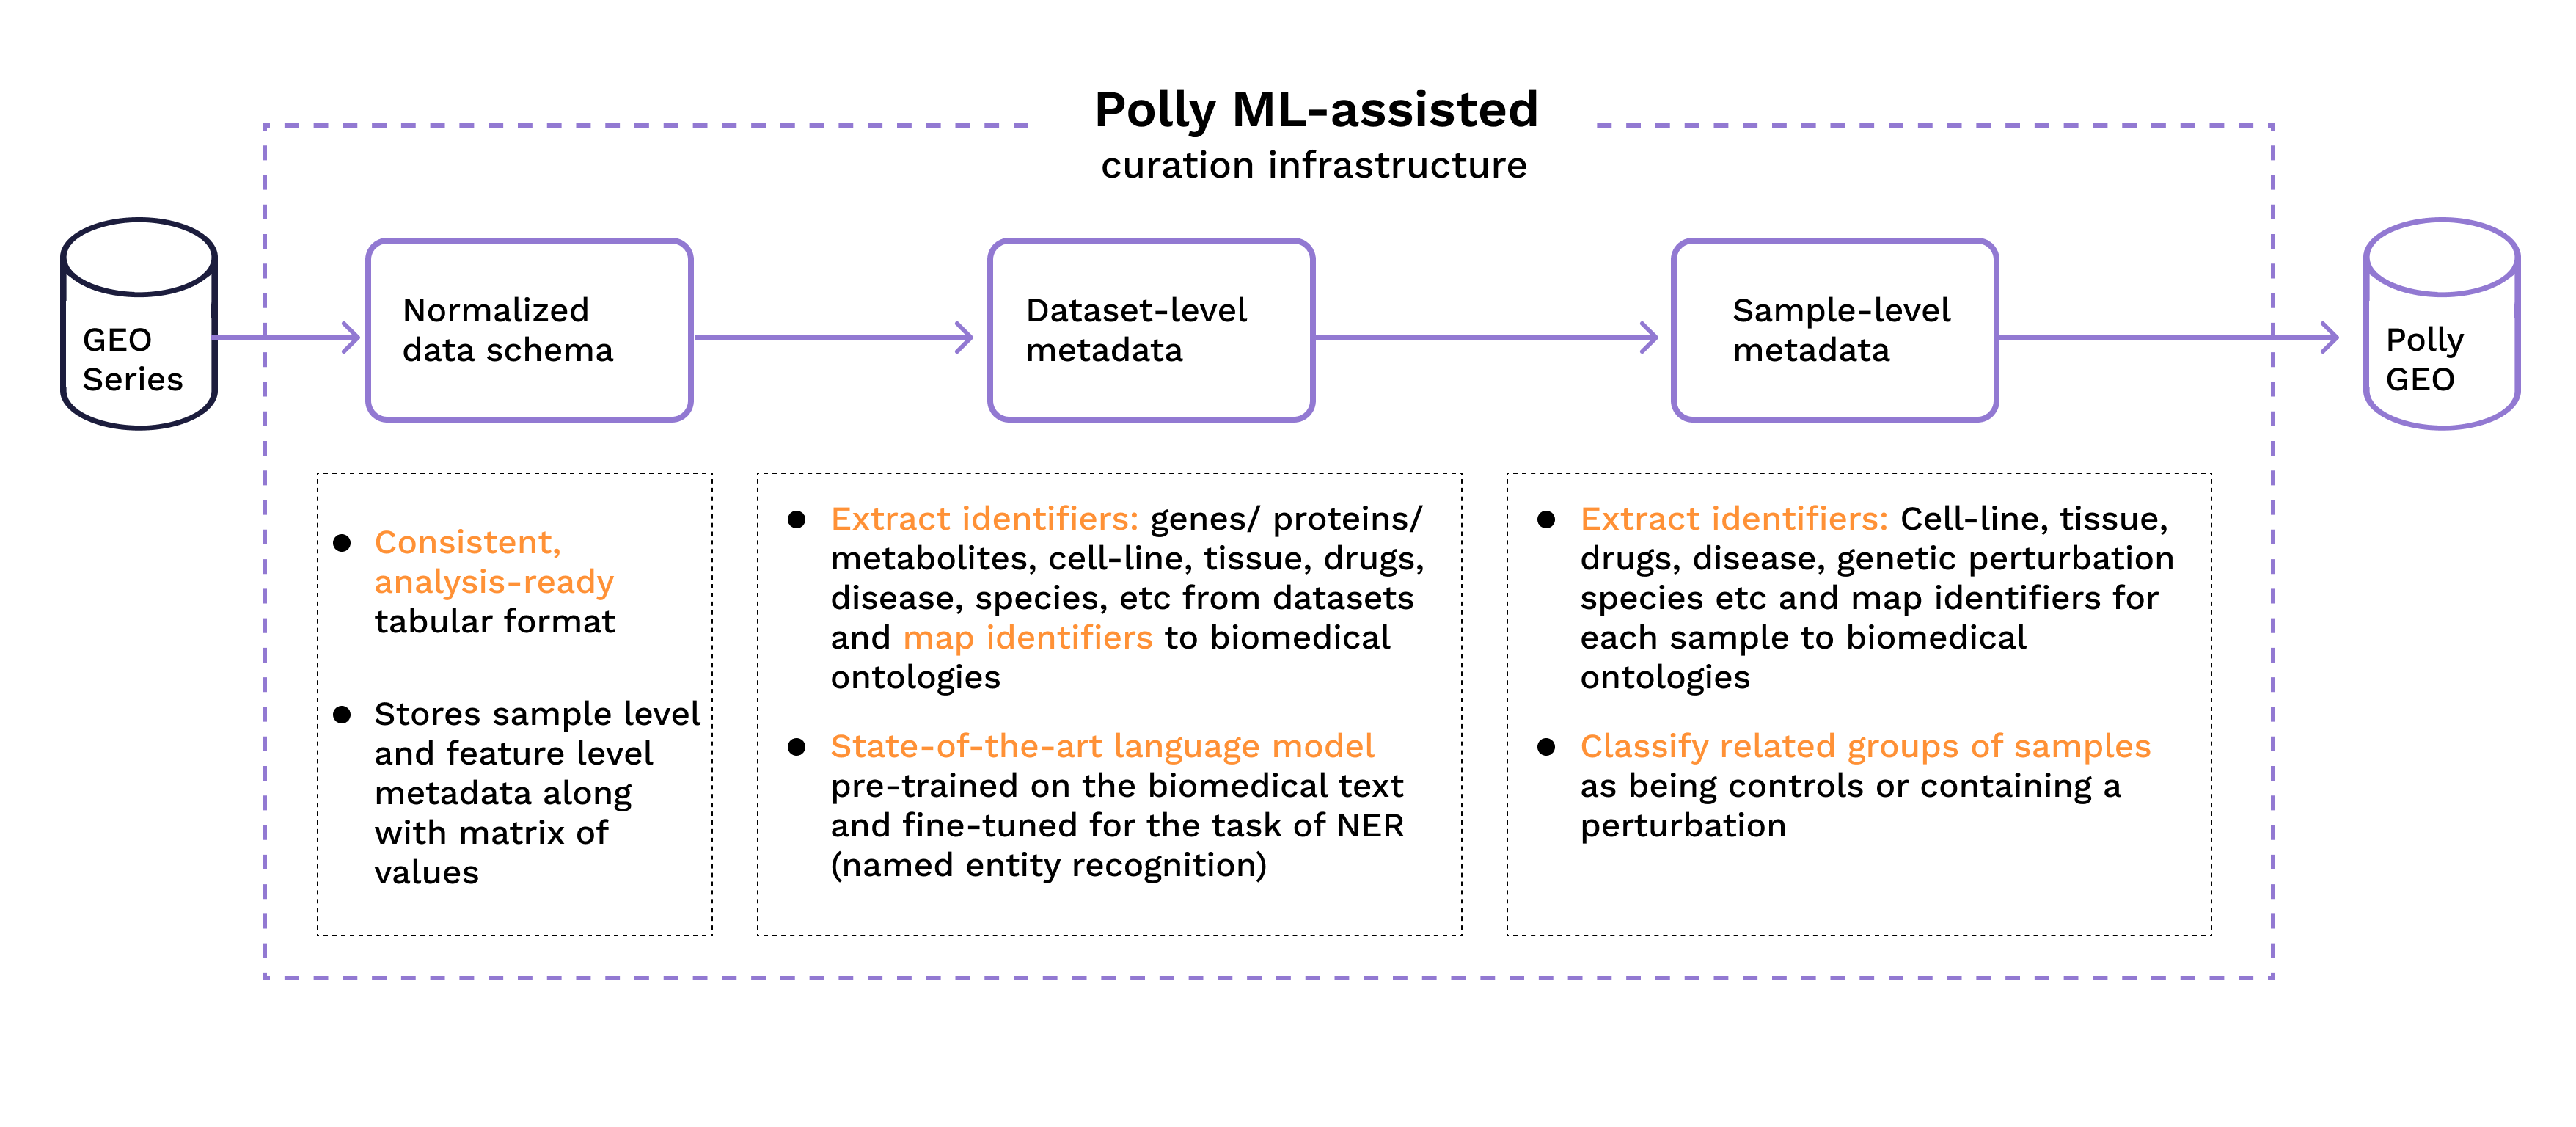 Figure 2: Curation process and main constituents of the infrastructure
Outcomes
Improvement in FAIR score post curation
The score for each study was calculated again after curation with the help of Polly ML-assisted curation infrastructure. The minimum ~80% score for Polly GEO (post curation) is nearly equal to the maximum score for GEO. The difference between FAIR scores for GEO and Polly is significant, Polly has a higher score for most of the datasets with average score being 88% as compared to source’s score of 60% (See figure 3 below).
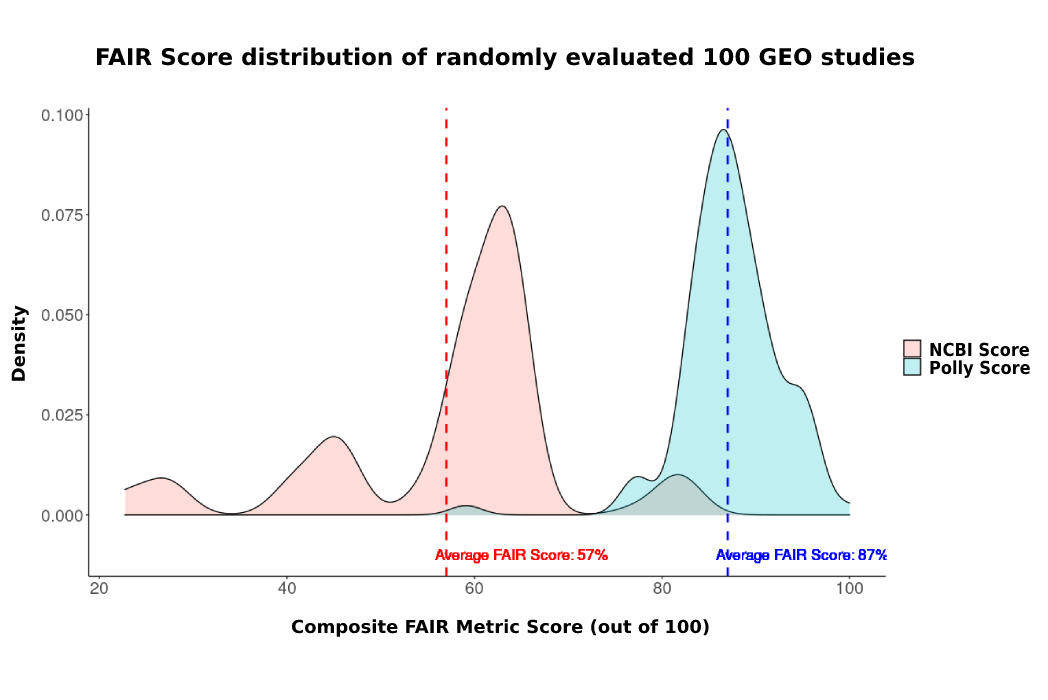
Figure 3: The plot represents a distribution of percentage increase of composite FAIR scores on Polly from randomly sampled 100 GEO studies.
Outcome summary:
- A method to quantify the impact of curation on microarray and RNA Seq data from GEO
- Quantification of FAIR score pre and post curation on GEO
- An ML-assisted curation infrastructure for FAIRification of molecular omics data
- Improved querying of data from a rich publicly accessible resource
References and Resources
- Ron Edgar, Michael Domrachev, Alex E. Lash, Gene Expression Omnibus: NCBI gene expression and hybridization array data repository, Nucleic Acids Research, Volume 30, Issue 1, 1 January 2002, Pages 207–210, https://doi.org/10.1093/nar/30.1.207
- Wilkinson, M. D. et al. 2016 The FAIR Guiding Principles for scientific data management and stewardship. Data 3, 160018. doi.org/10.1038/sdata.2016.18
- https://www.ncbi.nlm.nih.gov/geo/info/soft.html
- Wang, Z., Monteiro, C. D., Jagodnik, K. M., Fernandez, N. F., Gundersen, G. W., … & Ma’ayan, A. (2016) Extraction and Analysis of Signatures from the Gene Expression Omnibus by the Crowd. Nature Communications doi: 10.1038/ncomms12846
- Matthew N Bernstein, AnHai Doan, Colin N Dewey, MetaSRA: normalized human sample-specific metadata for the Sequence Read Archive, Bioinformatics, Volume 33, Issue 18, 15 September 2017, Pages 2914–2923, https://doi.org/10.1093/bioinformatics/btx334
At a Glance
Team
- Scientific Owner (2)
- Machine Learning Engineer (1)
- Data Scientist (2)
- Data Curators (10)
- Software Developers (2)
Timeline
5 months
Benefits and deliverables
- Enabled the enhancement of 60,000 datasets from GEO to improve of FAIR implementation
- Gave ready access to analysis-ready data by machine (e.g. Polly tagger)
Authors
- Mukund Chaudhry, Data Engineer
- Pawan Verma, Bioinformatics Engineer (LinkedIn)
